Business Intelligence, Tecmilenio
ETL automation and dashboards
A Python pipeline that pulls institutional surveys from Qualtrics, cleans them and gets them ready for Power BI. No manual downloads, no licensing costs.
- Role
- Data Engineer and Developer
- Timeline
- Aug - Dec 2025
- Team
- Business Intelligence
- Stack
- Python, Qualtrics API, Power BI
Context
The team needed a faster way to pull and analyze the university's institutional surveys. Responses were downloaded from Qualtrics by hand, cleaned in spreadsheets and copied into the folder that fed the dashboards.
- Over 10 hours a week went into extracting and cleaning data.
- The same file existed in several versions, with no standard to keep the data consistent.
- Dashboards lagged behind because every refresh depended on a manual download.
What I built
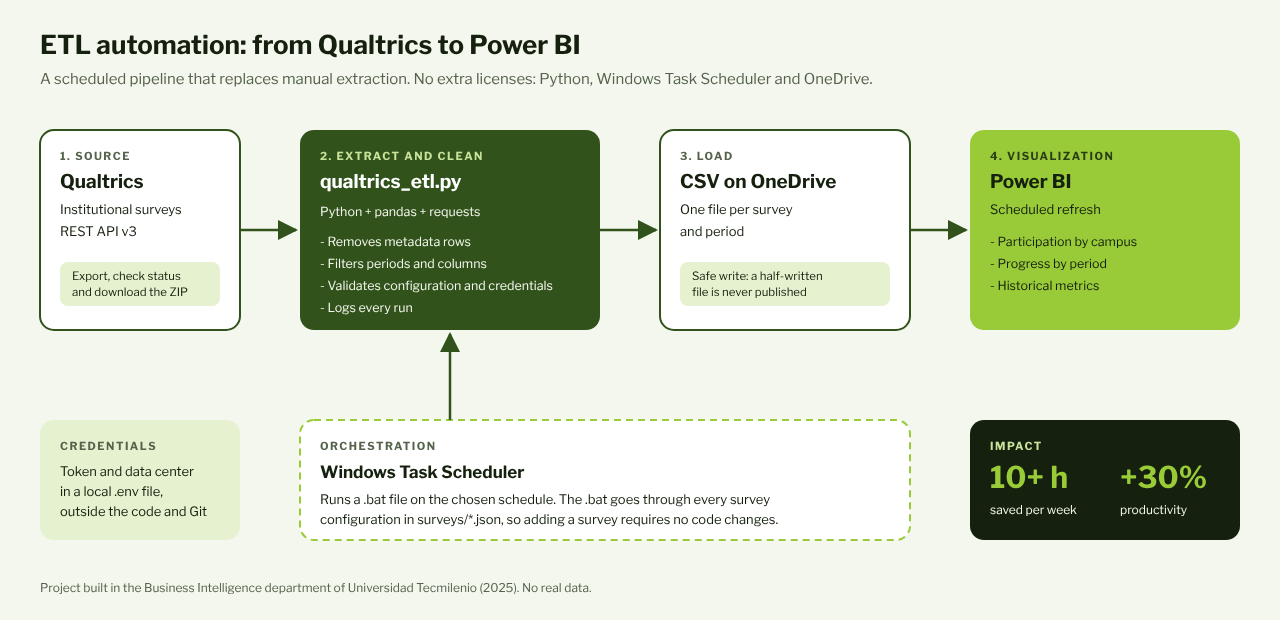
- API extraction: the script uses Qualtrics' asynchronous export (start the job, poll its status, download the ZIP), with timeouts and clear error messages.
- Cleaning: strips Qualtrics' metadata rows, filters by period and keeps only the columns each dashboard needs.
- Safe loading: writes one CSV per survey to OneDrive. If anything fails, the previous file is left untouched, so Power BI never reads half-written data.
- Scheduled runs: Windows Task Scheduler launches a
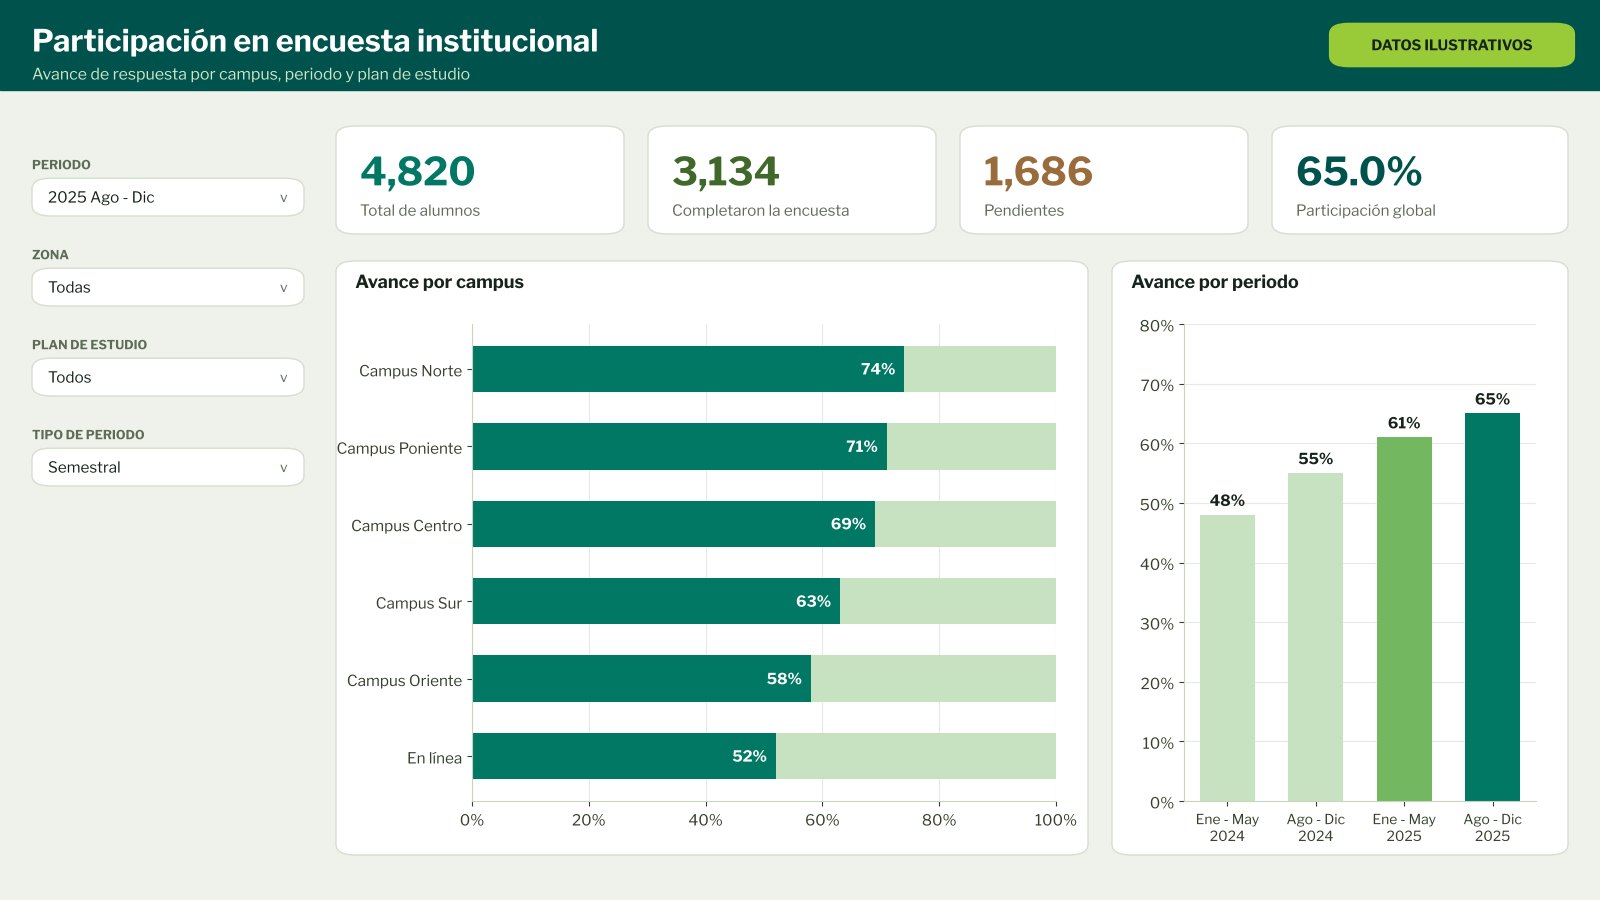
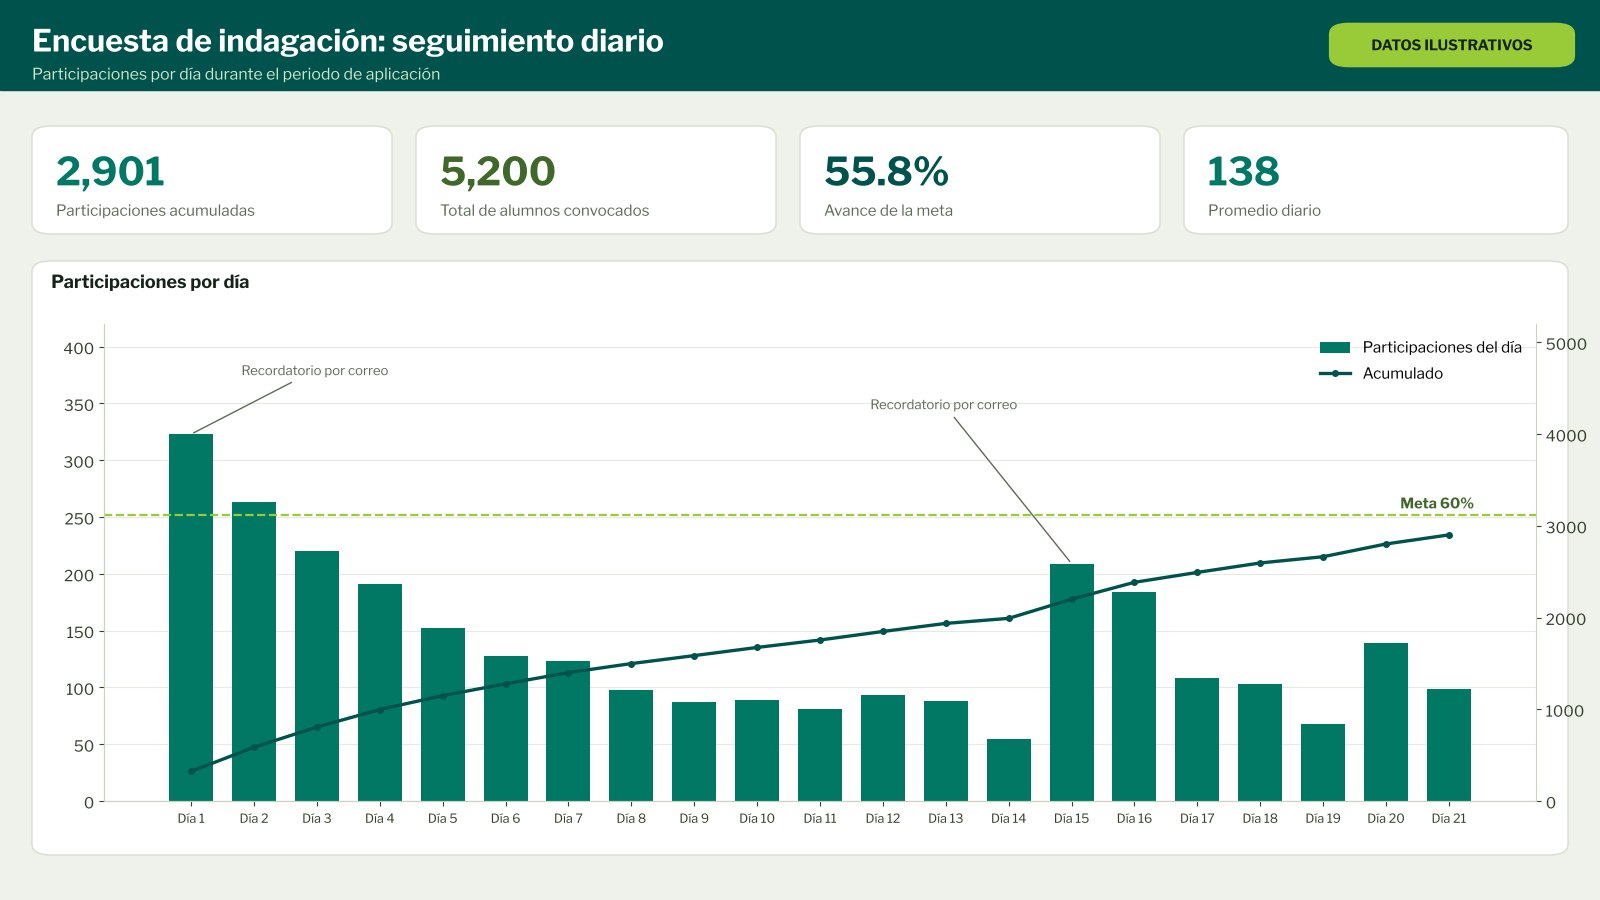
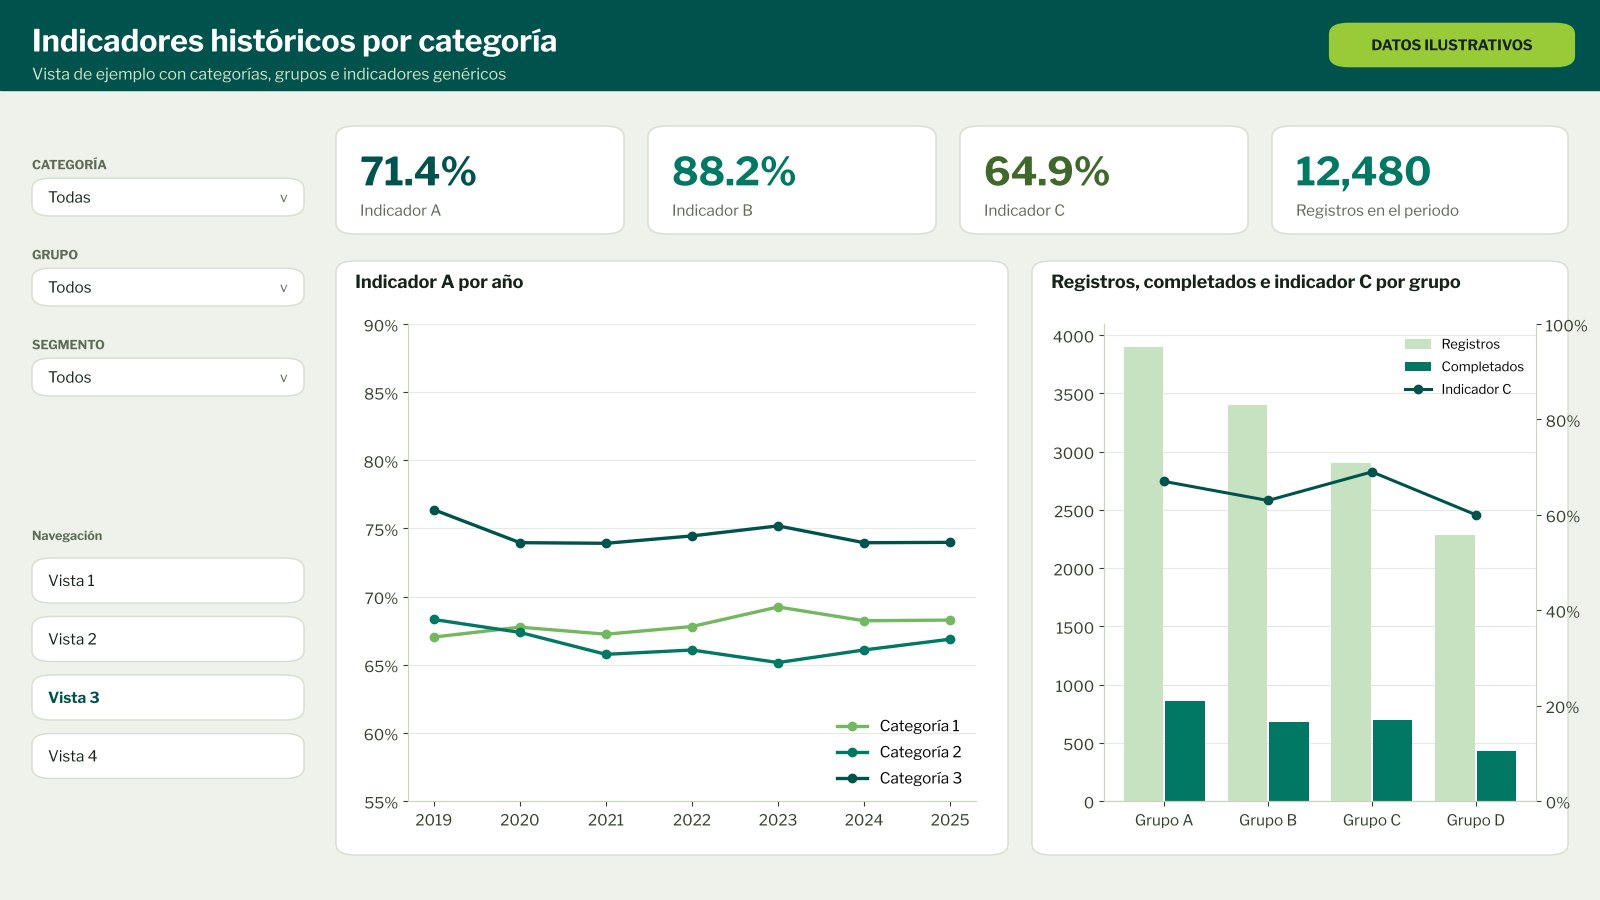
.batfile that processes every survey listed in a JSON config. Adding a survey takes no code changes. - Power BI dashboards: I built the participation and exploratory survey dashboards, and redesigned a historical KPI dashboard for the university's new website.
Impact
10+ h
saved every week on extracting and cleaning surveys, plus a 30% productivity boost in the team's reporting. All of it runs on tools the university already had, with no new licenses.
Dashboards
Replicas of the dashboards, keeping their original design. To protect the university's information, all data, names, categories and figures are fictitious. They were built for a Spanish-speaking audience, so the labels are in Spanish.
Next steps
- An interface that lets people with no programming background set up and run extractions.
- Moving the survey repositories into a data warehouse with cloud pipelines, as a single source of truth.
Resources
The repository includes the script, per-survey configuration, tests against a mocked API and a guide to scheduling runs. It was published with permission and contains no university data.